
Authors
- Rachel Abenavoli

- Elizabeth Reddington

- Patti Banghart Gottesman
- Dale Richards
- Jennifer Cleveland

- Bonnie Solomon

- Vasanthi Rao
- Leigh D'Amico
*The first two authors listed above contributed equally to the development of this fact sheet.
Not all child care providers serve the full number of children they are licensed to serve. Providers may operate below their licensed capacity for a variety of reasons, including insufficient demand for care from families, families’ inability to afford care, difficulty recruiting or retaining qualified staff, or space limitations—any of which can have implications for families’ access to child care and providers’ financial stability.
State policies that determine eligibility for child care scholarships, which help families pay for child care, may also affect enrollment numbers. In September 2023, following the end of federal pandemic relief funding, South Carolina’s Child Care Scholarship Program (CCSP) rolled back income eligibility for families from 300 percent of the Federal Poverty Level to 85 percent of State Median Income. Scaling back families’ eligibility for child care assistance may affect some providers’ ability to enroll children at their desired capacity.
In July and August 2025, Child Trends administered a survey[1] to South Carolina providers who were and were not serving children receiving scholarships to better understand providers’ experiences with enrollment and capacity. The survey also asked about providers’ experiences with CCSP and ABC Quality, South Carolina’s voluntary child care quality rating and improvement system. Of the 642 providers who responded to the survey, 63 percent were licensed child care centers, 35 percent were family child care homes, and 2 percent were license-exempt child care centers. Approximately 69 percent of respondents participated in CCSP and ABC Quality, 2 percent participated in ABC Quality only, and 28 percent did not participate in either program.
Most child care providers do not operate at full capacity
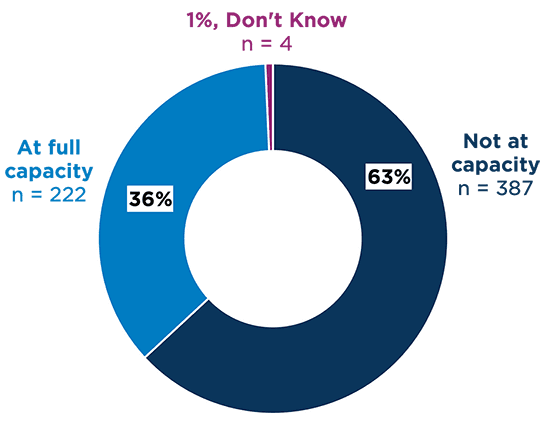
Based on survey responses from over 600 child care providers in South Carolina, most (63%) reported that they were not operating at “full capacity,” meaning they were not serving the maximum number of children they’re licensed to serve (Figure 1).
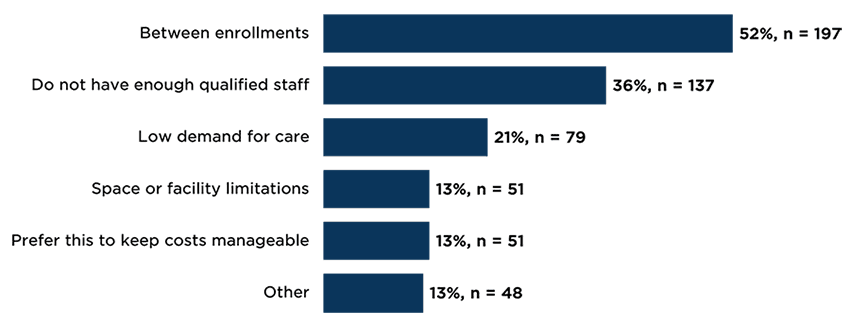
Of the 63 percent of providers not operating at full capacity, just over half (52%) indicated they were between enrollments, likely because providers were surveyed in July and August 2025, and one third (36%) noted they did not have enough qualified staff to serve more children (see section below and Figure 6 for more details).
Figure 1. Nearly two in three providers say they aren't operating at full capacity (n = 613)
Source: Child Trends and USC 2025 survey of South Carolina child care providers.
Note: This figure excludes 29 providers who did not respond to this item.
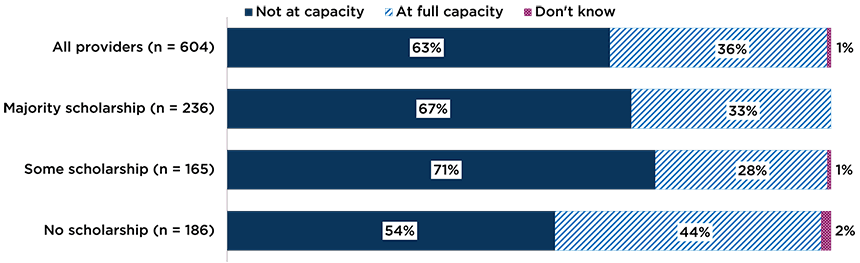
Figure 2 shows the percentage of providers operating at full capacity filtered by the percentage of children receiving child care scholarships in their programs. Providers were categorized by whether children receiving scholarships made up the majority of their total enrollment (50% or more; majority scholarship), some of their enrollment (1-49%; some scholarship), or none of their enrollment (0%; no scholarship). Approximately 67 percent of providers where the majority of children received scholarships reported that they were not operating at full capacity. Nearly three quarters (71%) of providers where some children received scholarships reported that they were not operating at full capacity, compared to just over half (54%) of providers who were not serving any children receiving scholarships.
Figure 2. More than two-thirds of providers with children receiving scholarships are not operating at full capacity, compared to about one-half of providers that are not serving children receiving scholarships (n = 604)
Source: Child Trends and USC 2025 survey of South Carolina child care providers.
Note: We categorized providers as majority scholarship if they reported children receiving scholarships made up 50-100% of total enrollment, some scholarship if children receiving scholarships made up 1-49% of total enrollment, and no scholarship if they did not serve any children receiving scholarships. This figure excludes from the top row 9 providers included in Figure 1 who did not respond to the item about scholarship enrollment. In addition, 17 providers did not know what percentage of their children received scholarships, so they are not represented in the bottom three bars of Figure 2, but they are included in the “All providers” bar at the top.
Among providers who are not at licensed capacity, most want to serve more children
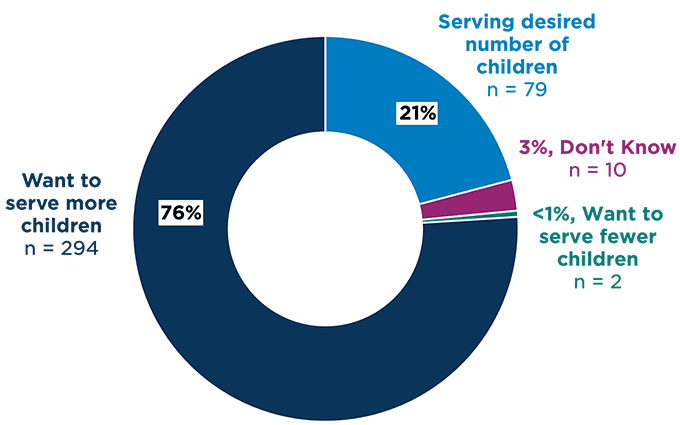
Of the providers who reported they were not at full capacity, most (76%) said they were not serving the number of children they want to be serving and would like to serve more children (Figure 3).
Figure 3. The majority of providers not currently operating at full capacity say they want to enroll more children (n = 385)
Source: Child Trends and USC 2025 survey of South Carolina child care providers.
Note: Of the 387 respondents who indicated they were not operating at full capacity, 2 did not respond to this follow-up question about whether they wanted to serve more children, and so they are not represented in this figure.
Among providers who want to serve more children, one quarter are experiencing a substantial gap between their current and preferred enrollment
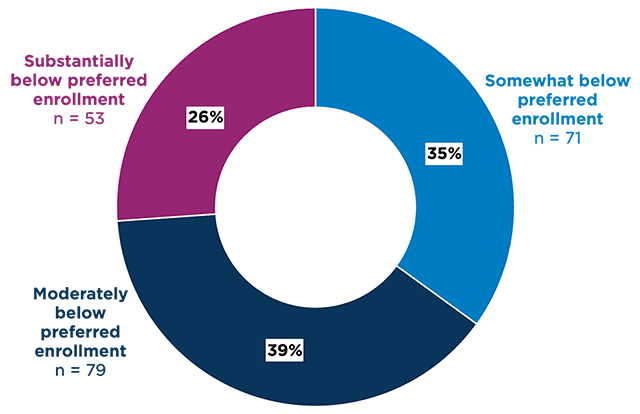
Of the providers who wanted to serve more children, approximately one in four (26%) were substantially below their preferred enrollment. An additional 39 percent of providers were moderately below their preferred enrollment, and 35 percent were somewhat below their preferred enrollment (Figure 4).
Figure 4. Most providers who want to serve more children say they are substantially or moderately below their preferred enrollment (n = 203)
Source: Child Trends and USC 2025 survey of South Carolina child care providers.
Note: We calculated percentage of preferred enrollment (i.e., current enrollment divided by preferred enrollment) and categorized providers as somewhat below preferred enrollment (i.e., current was 75-99% of preferred), moderately below preferred enrollment (i.e., current was 50-75% of preferred), or substantially below preferred enrollment (i.e., current was <50% of preferred). This figure excludes providers with missing or invalid responses for either current enrollment or preferred enrollment.
Of the providers who reported that they were substantially below their preferred enrollment, approximately 42 percent were providers where the majority of children received scholarships (not shown).
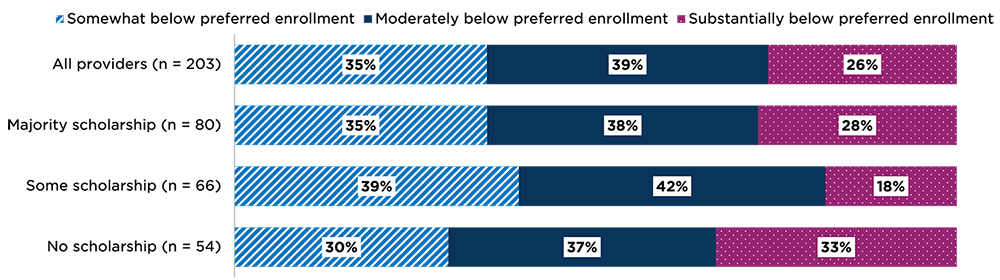
Figure 5 examines the gap between providers’ current and preferred enrollment by the percentage of children receiving child care scholarships in their programs. Providers were again categorized by whether children receiving scholarships made up the majority of their total enrollment (majority scholarship), some of their total enrollment (some scholarship), or none of their enrollment (no scholarship). Across providers serving no, some, or a majority of children receiving scholarships, approximately 60 to 70 percent of providers under capacity reported that their enrollment was moderately or substantially below their preferred enrollment. Although the exact percentages varied across scholarship enrollment groups, these differences were not statistically significant, meaning they could be due to chance rather than reflecting true differences between groups.
Figure 5. Among providers operating below capacity, the gap between their current and preferred enrollment did not vary significantly by scholarship enrollment (n = 203)
Source: Child Trends and USC 2025 survey of South Carolina child care providers.
Note: This figure is limited to providers who reported that they wanted to serve more children and reported current enrollment numbers below their preferred enrollment. Three providers did not know how many children received scholarships, so they are not represented in the bottom three bars, but they are included in the “All providers” bar at the top.
A shortage of qualified staff limit providers’ ability to serve more children
As noted above, of the providers who were not operating at full capacity, over one third (36%) said they did not have enough qualified staff to serve more children (Figure 6). Approximately 20 percent (21%) said there was low demand, and half said they were currently between enrollments. This is most likely since providers were surveyed in July and August 2025, when families may change care arrangements for the summer or beginning of the next school year.
Figure 6. Being between enrollments and not having enough qualified staff are the most common reasons for providers serving fewer children than they are licensed to serve (n = 380)
Source: Child Trends and USC 2025 survey of South Carolina child care providers.
Note: Examples of “other” reasons reported by 13 percent of providers included: choosing to operate below capacity to provide more individualized care or reduce staff stress; ratio requirements tied to NAEYC or ABC Quality that differ from licensing standards; affordability challenges for families; not accepting vouchers; local competition; and transportation constraints (e.g., inability to provide after-school pick-up).
Providers reported that financial support and help with recruiting and retaining staff could help increase enrollment
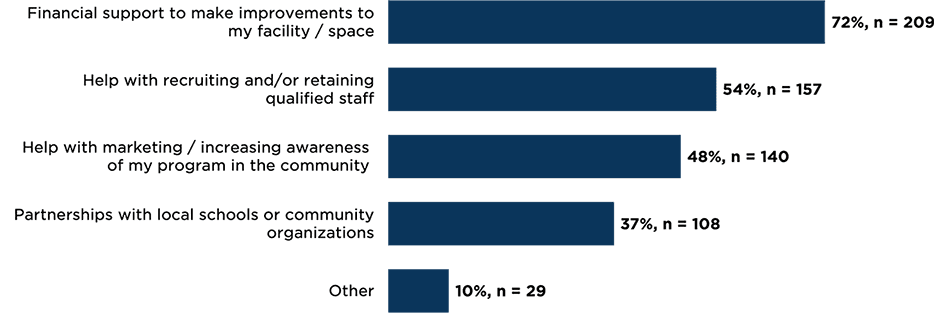
Of the providers who wanted to serve more children, nearly three quarters (72%) reported that financial support to make improvements to their facility would help them increase enrollment (Figure 7). In addition, over half (54%) reported that help with recruiting and retaining qualified staff would help them increase enrollment.
Figure 7. Providers who want to serve more children say they need financial support for facility improvements and help recruiting and retaining qualified staff (n = 290)
Source: Child Trends and USC 2025 survey of South Carolina child care providers.
Acknowledgements
The project, “Advancing Access to High Quality Child Care and Early Education for South Carolina Families,” is supported by the Administration for Children and Families (ACF) of the United States (U.S.) Department of Health and Human Services (HHS) as part of a financial assistance award (Award #: 90YE0317) totaling $400,000 annually, pending approval, with 100 percent funded by ACF/HHS. The contents are those of the authors and do not necessarily represent the official views of, nor an endorsement, by ACF/HHS, or the U.S. Government. For more information, please visit the ACF website, https://acf.gov/.
The authors thank our partners in the South Carolina Department of Social Services for their thought partnership, guidance, and review of this work. We also thank our colleagues, Rowan Hilty and Sage Caballero-Acosta, for their support with the development of this product.
Suggested citation
Abenavoli, R.,* Reddington, E.,* Banghart, P., Richards, D., Cleveland, J., Solomon, B., Rao, V., & D'Amico, L. (2026). Enrollment and Capacity Challenges among South Carolina Child Care Providers. Child Trends. DOI: 10.56417/9476k2967c
*These authors contributed equally to the development of this fact sheet.
[1] This survey was administered prior to CCSP implementing a pause on accepting scholarship application in December 2025 (unless a family is eligible because they’re within a protected category).